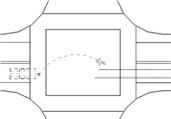
2006 Ford Mustang into 1987 Chevrolet Caprice
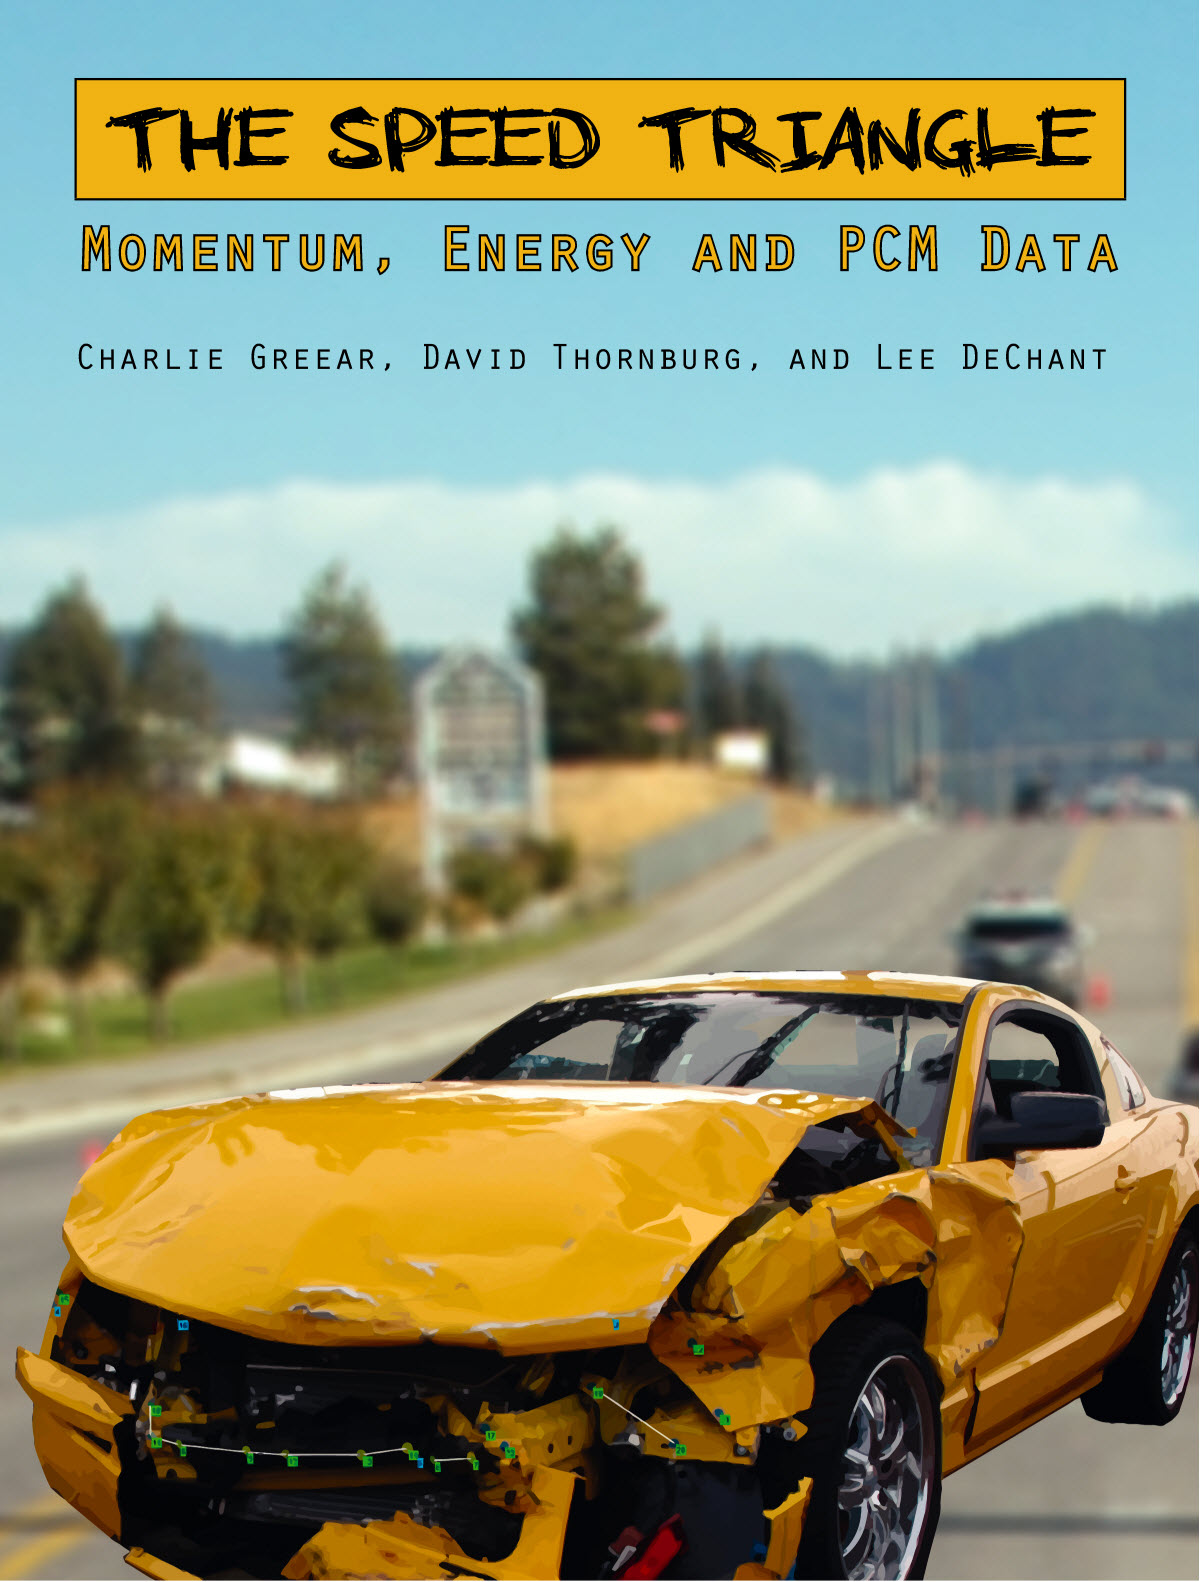
This example is taken from a case study The Speed Triangle – Momentum, Energy, and PCM Data by Charlie Greear, David Thornburg, and Lee DeChant published in COLLISION magazine, Volume 6, Issue #1, page 48.
(A reprint of the article can be downloaded from www.iwitnessphoto.com by clicking HERE)
In this collision, a Ford Mustang was racing a Subaru Impreza WRX, and ended up T-boning a 1987 Chevrolet Caprice. There are no side impact tests for the Chevrolet Caprice in the NHTSA Crash Test database, so the authors chose to use a Force-Balance approach to derive the Stiffness values for the Caprice. This example shows how the Force Balance module in the 2011 version of 4N6XPRT StifCalcs® can be used to quickly and easily perform the calculations with the added bonus
of obtaining the KE Equivalent Speed, Delta-V, and Closing speed based strictly upon the damage to each vehicle.
The Bullet vehicle in this case was a 2006 Ford Mustang.
1) Using the 4N6XPRT StifCalcs® BASIC SEARCH, we click on 2006 – FORD – MUSTANG ….
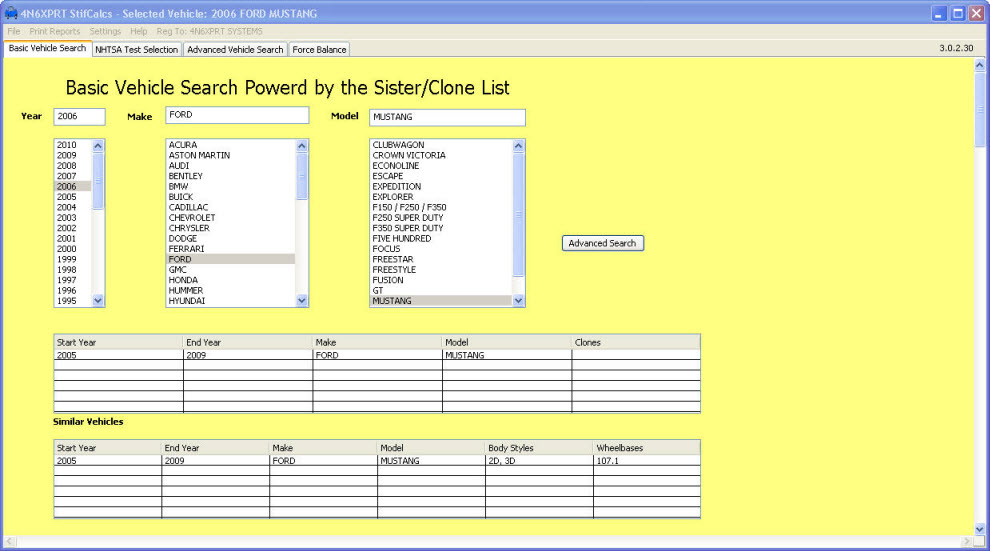
2) At this point, we click on the NHTSA TEST SELECTION tab to see what tests are available.
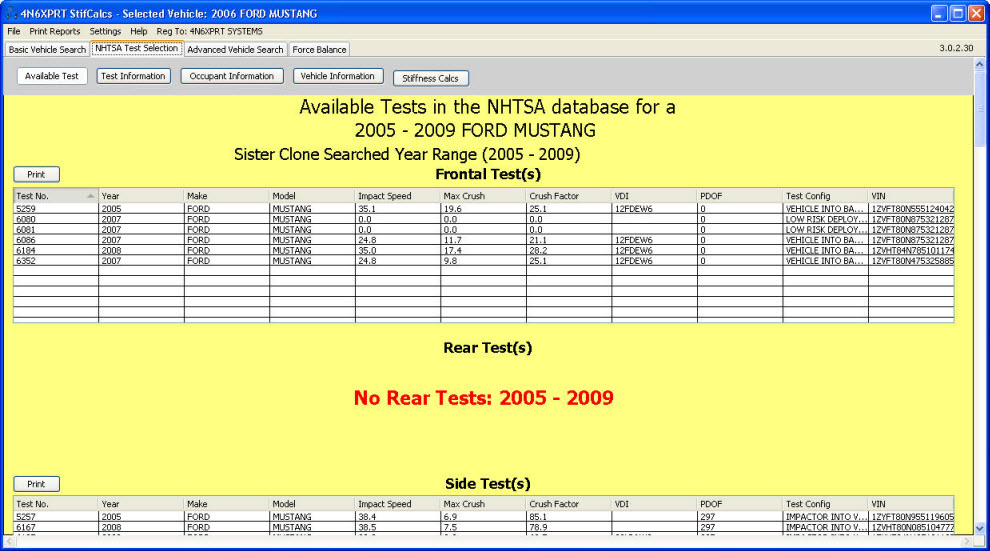
3) When we click on the PRINT button above the FRONTAL TEST(s) box, we get the Test Summary Test Criteria box where we designate the NO DAMAGE SPEED, Crush Depth to use, Crush Length to use, and Speed to use.
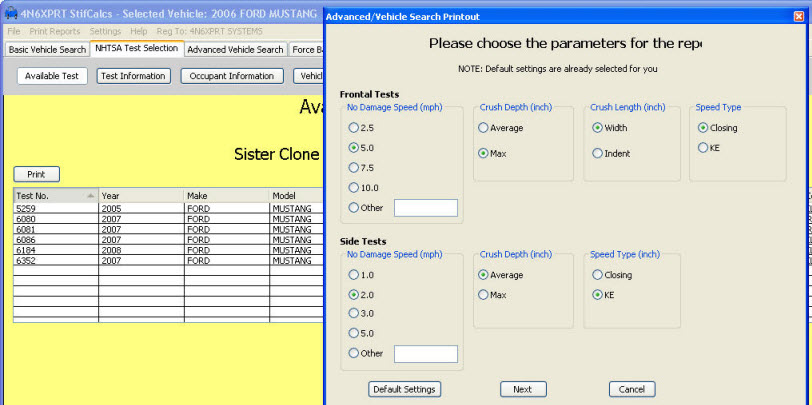
4) When this has been set (in this example, 5.0 mph, Maximum Crush, Vehicle Width, Closing Speed) click NEXT
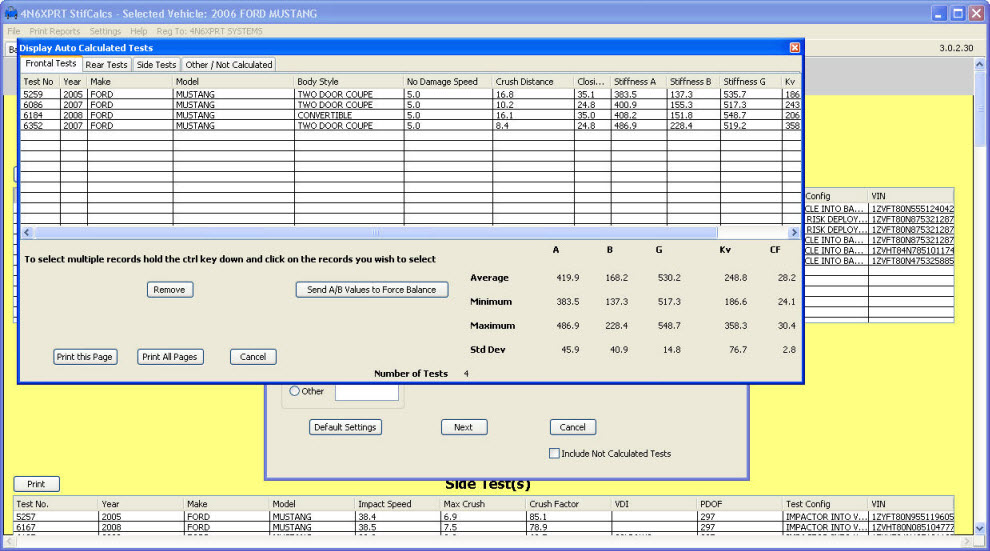
5) Clicking the SEND ALL VALUES TO FORCE BALANCE imports the A-B Stiffness values to the Force Balance module.
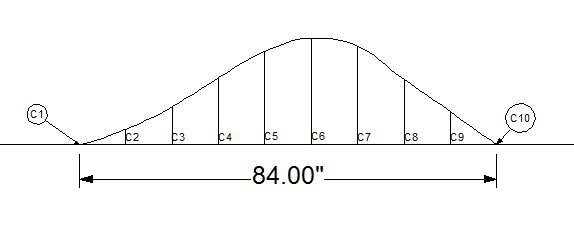
Before continuing with the Force Balance example, lets quickly examine the crush measurements to be used. The Authors of the Speed Triangle article showed the following crush profiles, and used 10 equally spaced crush measurements for their Force Balance Calculation. The profiles and the Force Balance results were as follows:
Author’s Mustang Crush Profile
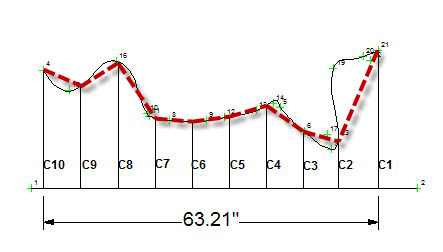
Author’s Caprice Crush Profile – Measured Front to Rear
Author’s Crush Measurements and Force Balance Results

When you examine the two Crush Profiles, you can see the following:
- Caprice Profile – The profile from C3 to C5 and from C7 to C10 is essentially a straight line in each case. Therefore while the inclusion of the C4 and the C8 & C9 measurements are in line with crush measurement protocol, they are in essence meaningless measurements as far as the average crush for the Caprice is concerned.
- Mustang Profile – The red dotted line overlaying the Authors Crush Profile illustrates the crush profile described by the 10 equally spaced crush measurements. In this instance, by using equally spaced crush measurements, a number of “critical points” of the profile are missed, most significantly between C1 and C2. This in turn affects the average crush depth that is used for calculating the force applied to the Mustang to create its damage.
The problems noted for both profiles are NOT a “fault” of the Authors, but ARE a problem which is inherent with a protocol that requires equal spacing between measurements.
When you compare the crush profiles used by the Authors with the NON-EQUAL spacing crush measurements used in 4N6XPRT StifCalcs® for this same Force Balance example, you can see that in the case of the Mustang profile, the measurements more closely mirror the actual crush profile of the vehicle, and in the case of the Caprice the same profile can be depicted with fewer measurements.
Mustang Crush – Unequal Spacing
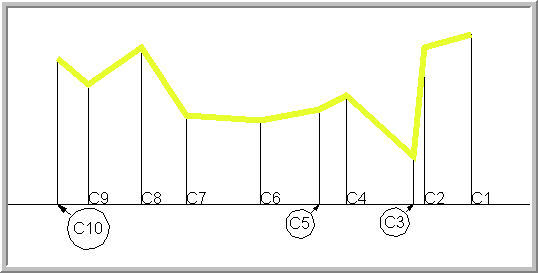
Caprice Crush – Unequal Spacing
(Measured Front to Rear)

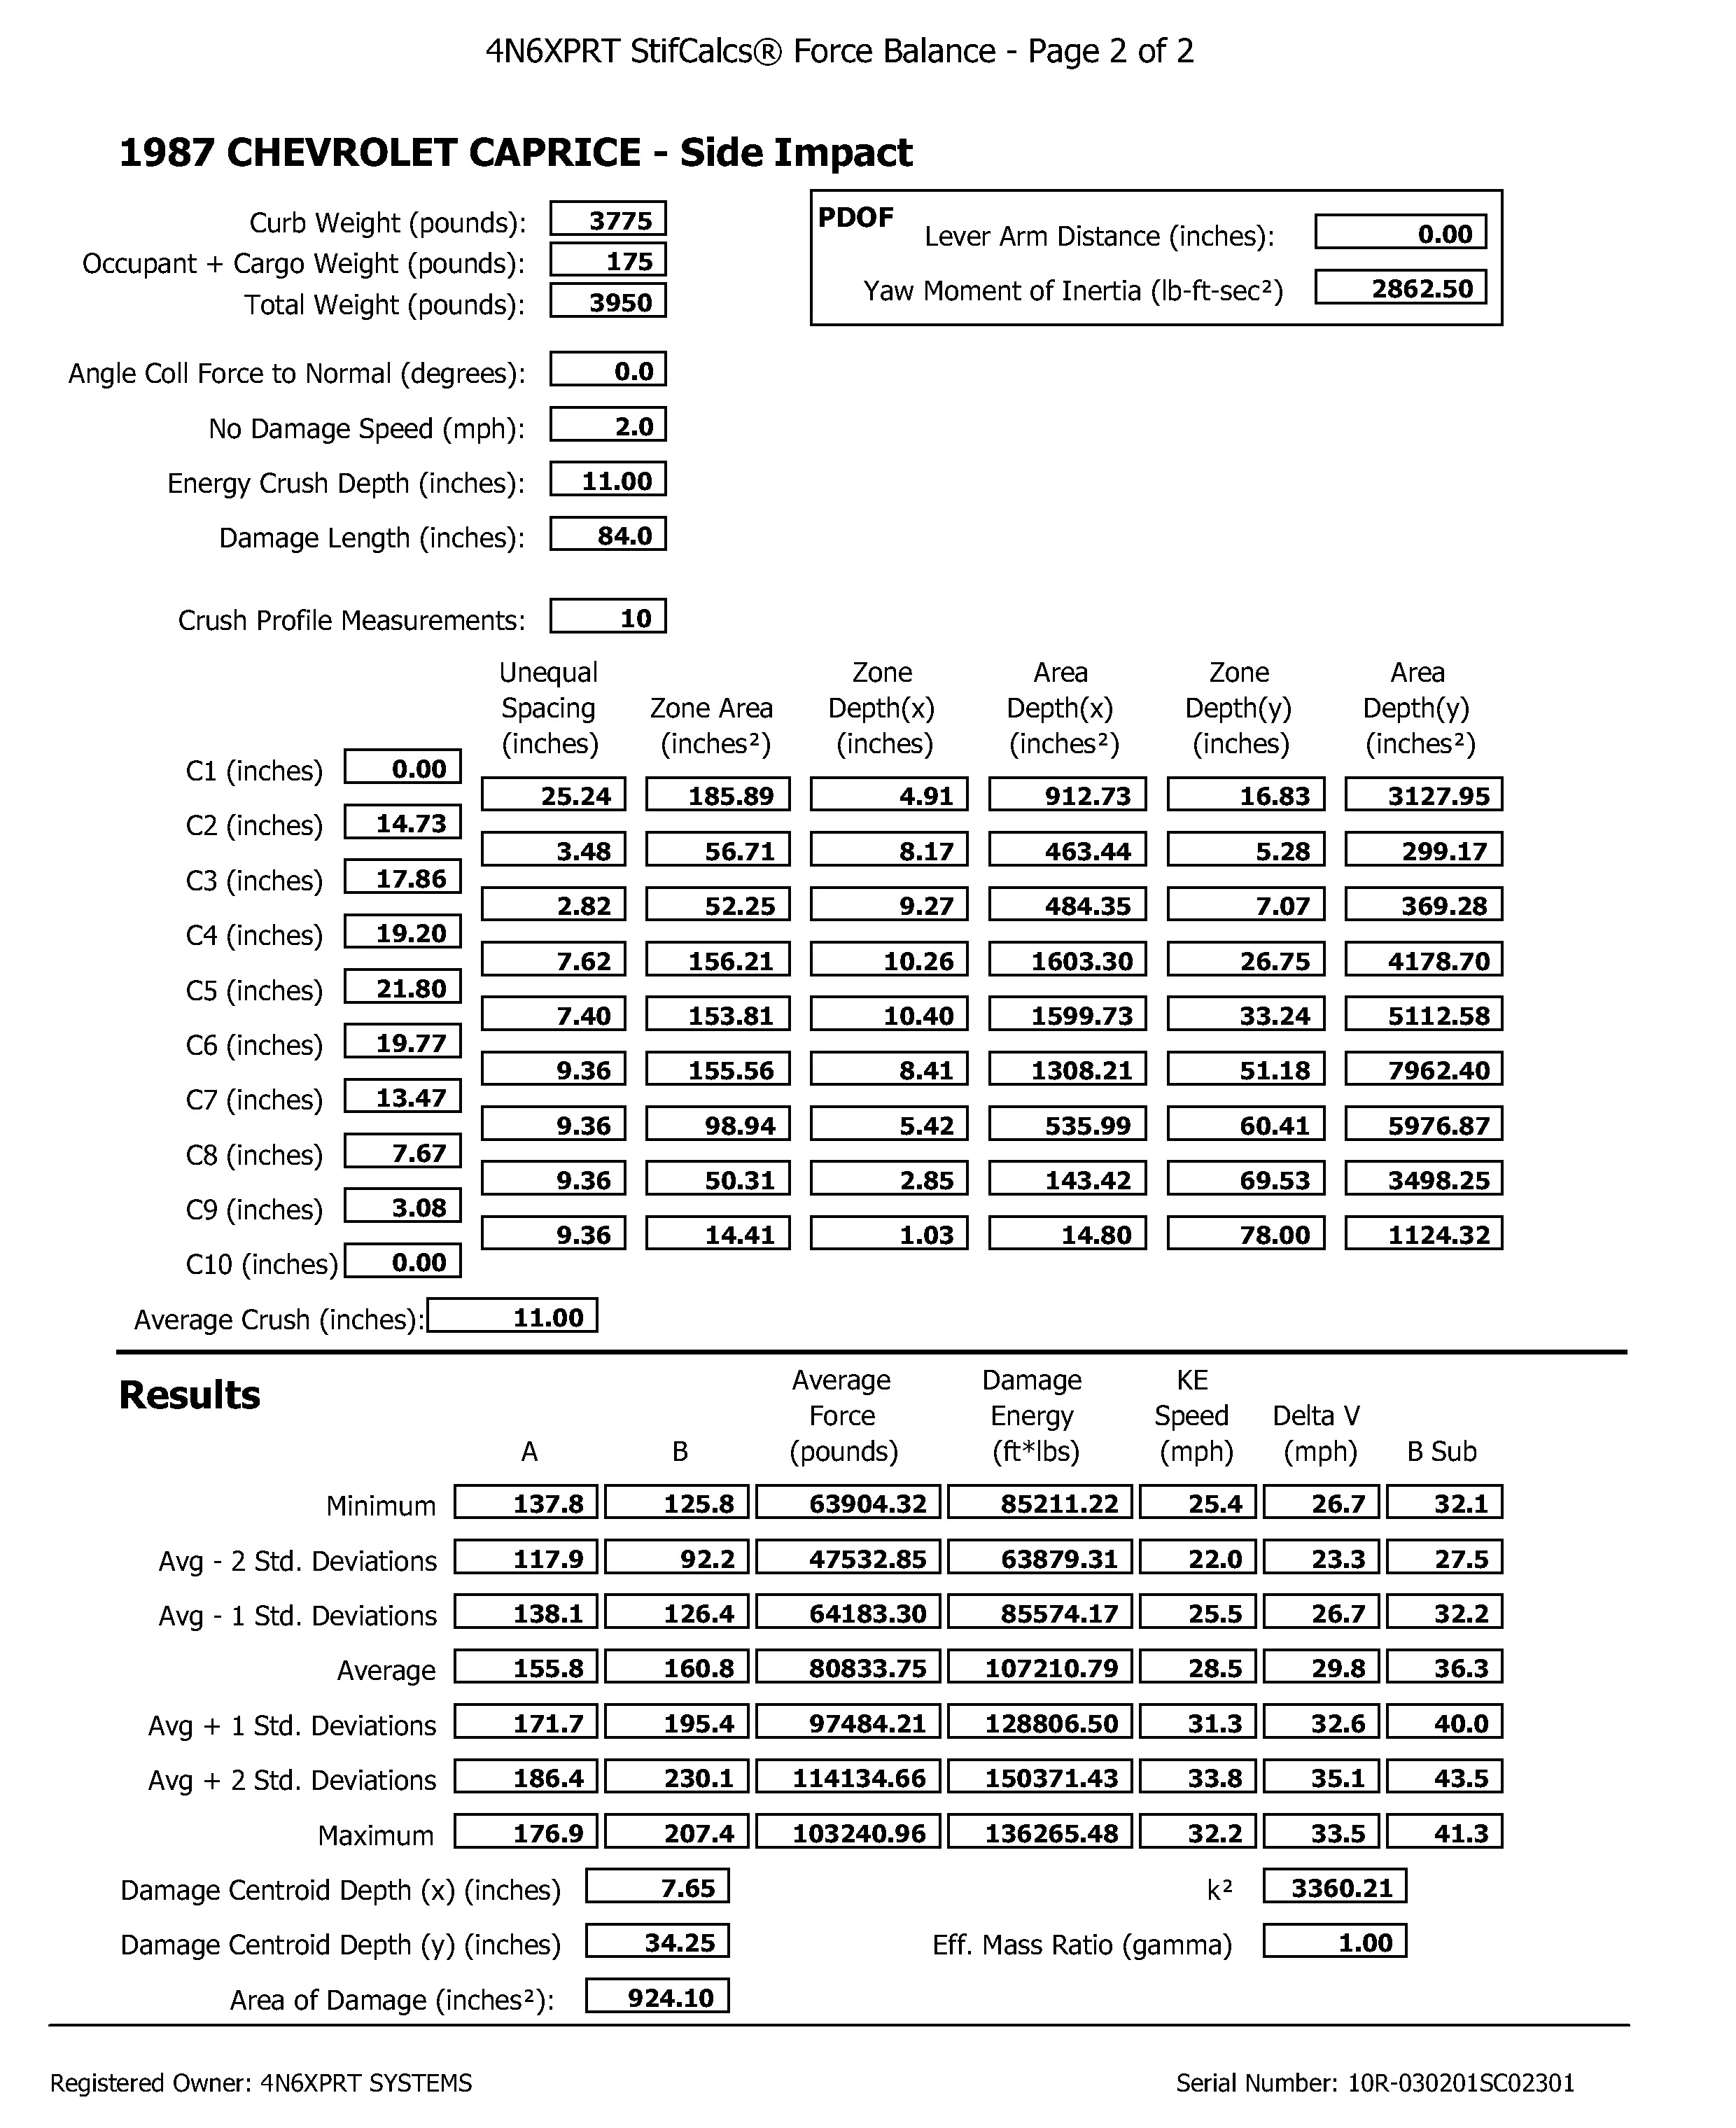
6) Continuing with the Force Balance example, you can see that after entering the vehicles from the AS Lite, and entering the Crush Profile for both vehicles (for this example the NON-EQUAL spacing was used, but EQUAL SPACING is also permitted within the module, and is, in fact, the default), all that is left to do is print and review the results. Sample output can be seen on the next page.
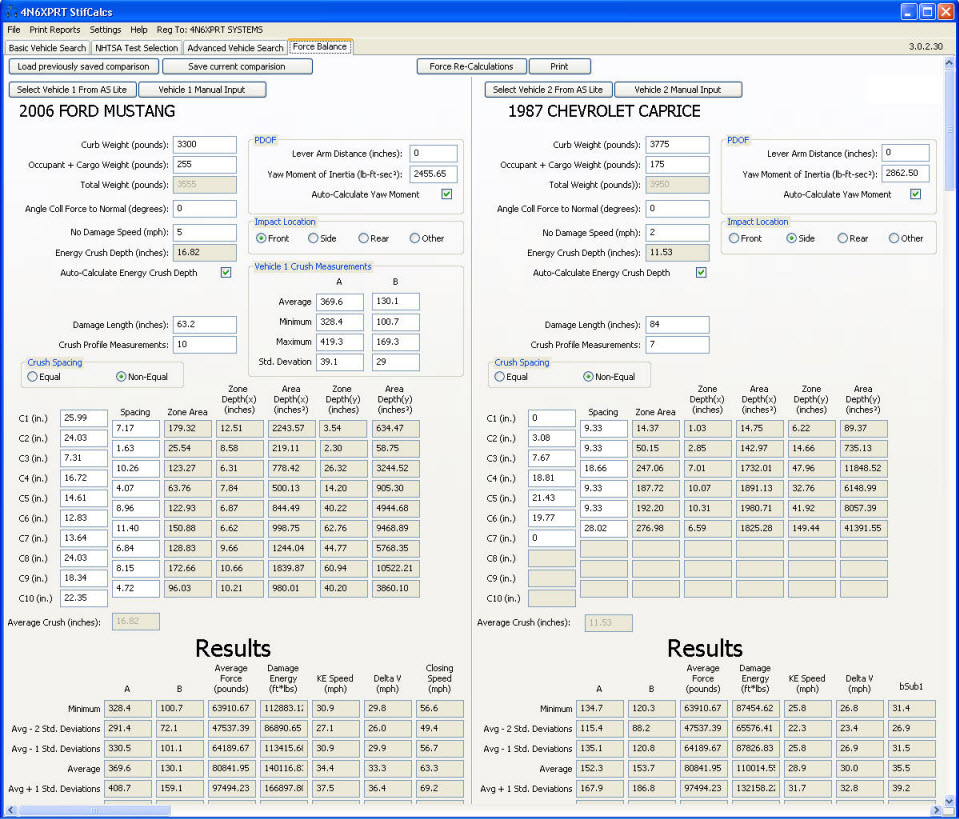
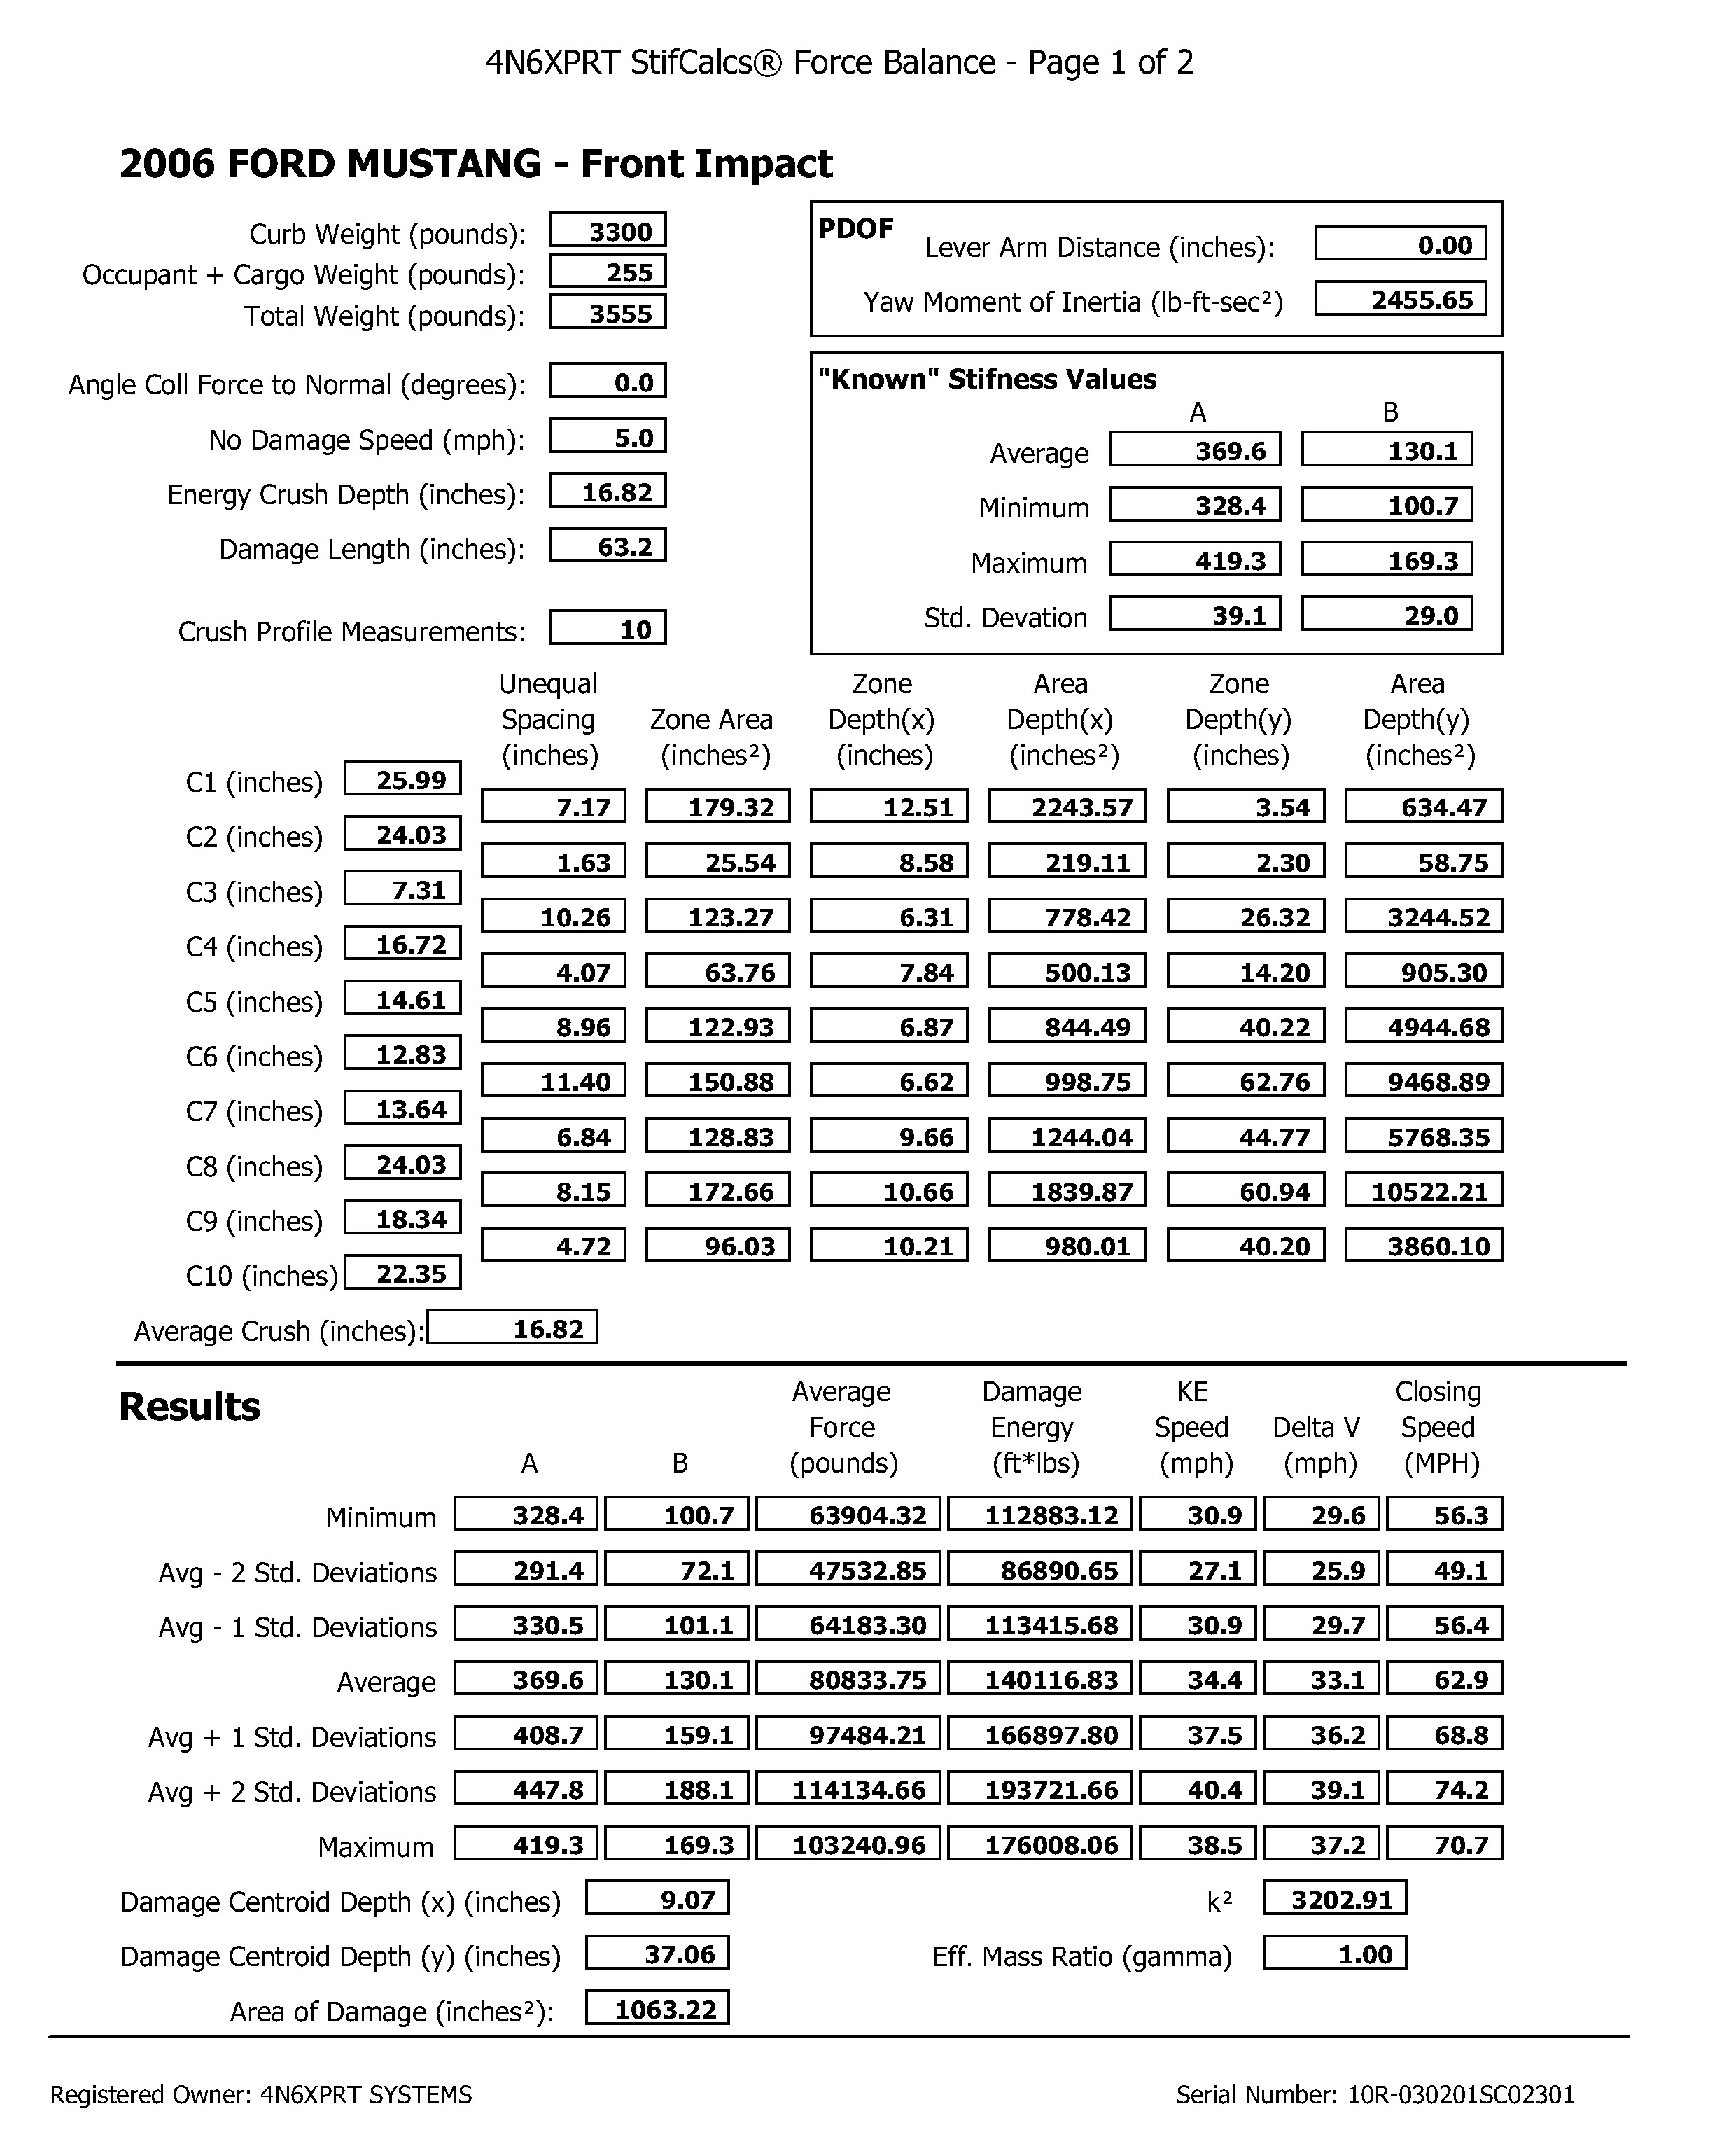
The Authors found that the Mustang had a speed of 54-62 mph at impact with the Caprice. Compare this speed range with the Closing Speed calculated FROM DAMAGE ONLY by the Force Balance module, concentrating on the values between the Average and Average – 1 Std Deviation (56-63 mph) that were derived from the four NHTSA frontal crash tests on Ford Mustangs. Be sure to also compare the calculated Average Crush for each vehicle and the derived A-B values for the Caprice, which would then be used in a CRASH 3 analysis to further refine your opinions.
FORCE BALANCE OUTPUT
Non-Equal Spacing Crush Profile
Stiffness Values calculated using MAXIMUM CRUSH from NHTSA Crash Test Database
Several SAE papers discuss the Force Balance method, among them – 970942 / 1999-01-0079 / 2005-01-1188 and 2005-01-1205.
Background and formula for the calculations can be found in Balancing Collision Forces in Crush / Energy Analysis by Nathan Shigemura and Andrew Rich available from the IPTM Webstore ( http://www.iptm.org/webstore/ ) under Crash
Investigation Publications. A PDF with the above step-by-step approach to using the Force Balance module can be downloaded from:
4N6XPRT StifCalcs Force Balance Example
The PDF has the added pages of the Force Balance for these same two vehicles based on the Ford Mustang’s AVERAGE Crush. For more on this new program, and to see a sample printout, please download the documents from the following links.
As an extension of our Individual Vehicle Data Search Service, we have now added Force Balance Analysis runs to our services. An order form with pricing can be downloaded from this link.


